The cronova Web Console
The cronova web console is the built-in UI for the cronova workflow scheduler: a single-page app for creating DAGs, watching runs, streaming logs, and administering pools, variables, and API tokens. This guide walks through every screen; this page covers the layout, navigation, sign-in, and the console's auto-save edit model.
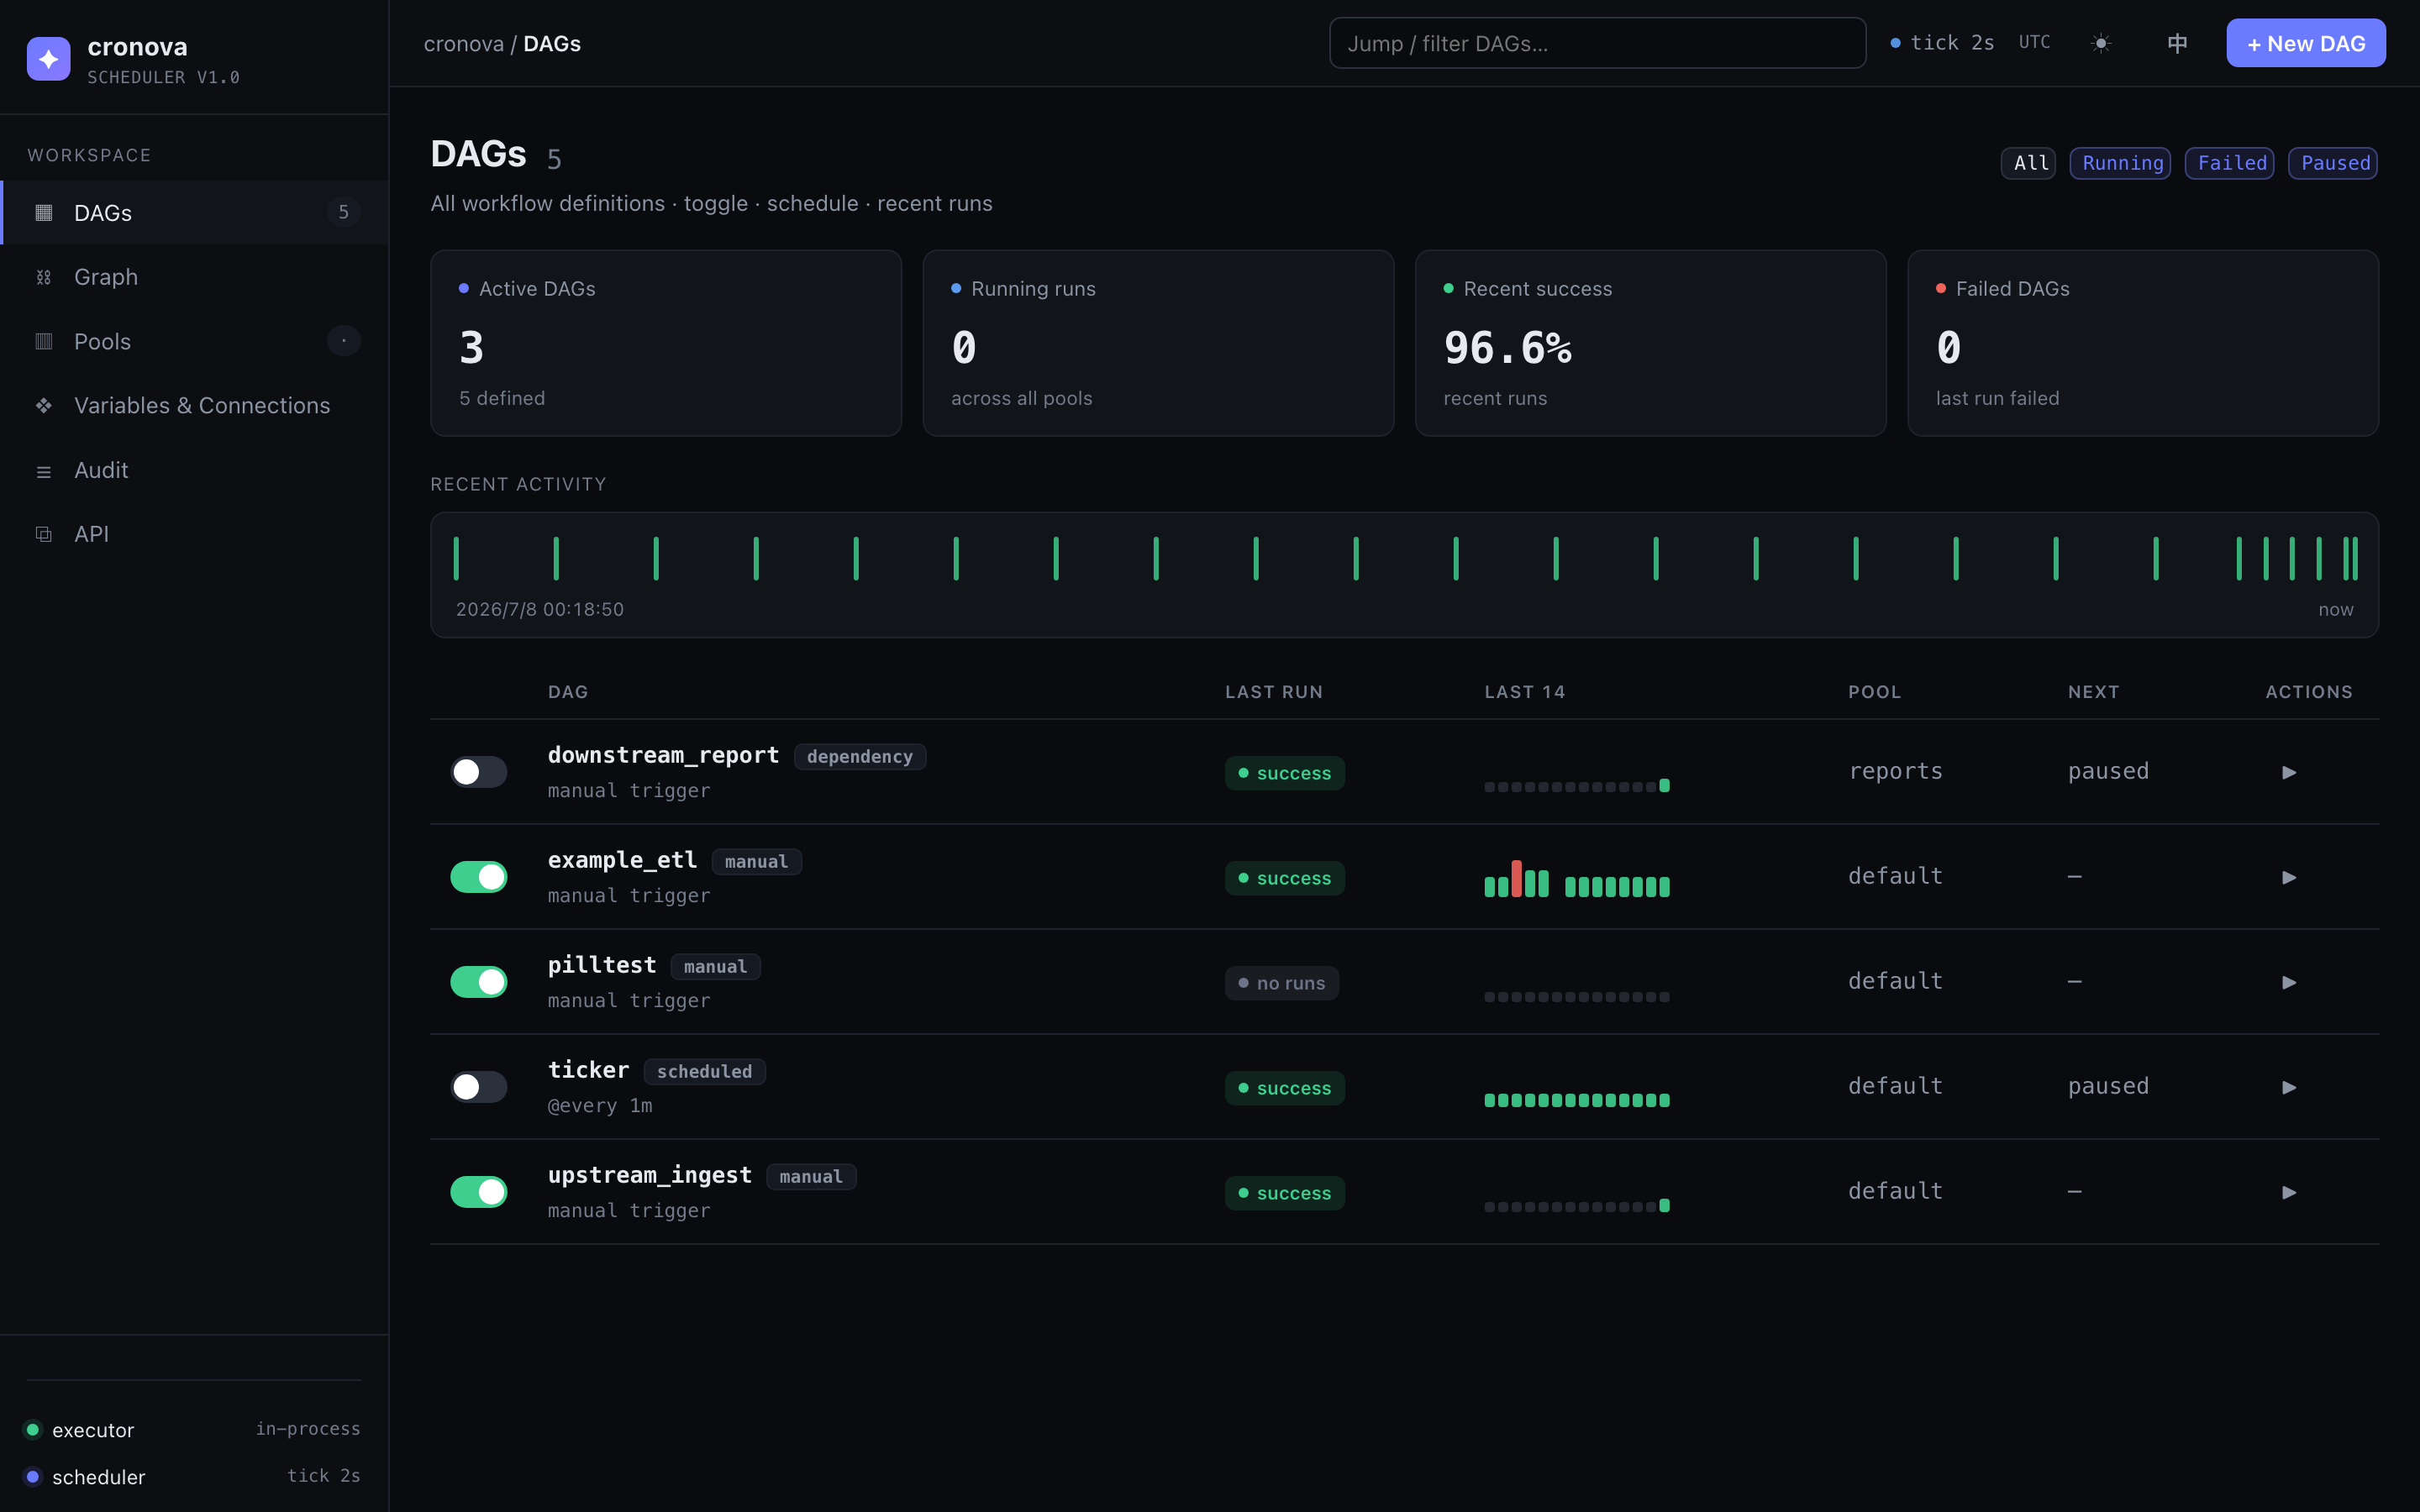
Opening the console
The console ships inside the cronova binary — there is nothing extra to install, build, or configure. Start the scheduler and open the printed address:
The default listen address is 127.0.0.1:8090; change it with the -http flag or the http: key in cronova.yaml (see Install & first run). Every drill-down in the console — a DAG, a task, a single run — is a hash route like #/dag/etl_daily/runs, so any view you are looking at can be bookmarked, refreshed, or pasted into a chat message.
Layout
The console is a two-pane app: a fixed sidebar on the left for switching workspaces, and a content area with a topbar on the right.
Sidebar
| Item | What it shows |
|---|---|
| DAGs | The dashboard: every workflow definition with pause toggles, sparklines, and recent-run status. The badge next to it counts your DAGs. |
| Graph | A cross-DAG graph of trigger dependencies (trigger_after) between workflows. |
| Pools | Concurrency pools that cap how many task instances run at once — see Admin pages. |
| Variables & Connections | Reusable variables, connections, and params for templating commands — see Admin pages. |
| Workers | The dial-in remote worker fleet: join tokens, live state, drain/remove — see Admin pages. |
| Audit | The audit log of who changed or triggered what. |
| API | API token management plus the built-in OpenAPI reference. |
Pinned at the bottom of the sidebar are two live status rows: executor (the execution target the scheduler dispatches to) and scheduler (its tick interval). They refresh every few seconds, so a dead executor or stalled scheduler is visible from any page. When authentication is on, your user chip sits just above them.
Topbar
| Control | What it does |
|---|---|
| Breadcrumb | cronova / <current page> — tracks where you are as you drill down. |
| Jump / filter DAGs… box | Global search. On the dashboard it filters the DAG table live; on every page it is an autocomplete that jumps straight to any DAG. |
| Tick indicator | The scheduler tick interval plus the server timezone label. Hover it for the rule: schedules evaluate in UTC, while timestamps on the page render in your local timezone. |
| ☀ / ☾ | Toggles between dark and light themes (dark is the default; your choice is remembered). |
| EN / 中 | Switches the whole UI between English and Chinese instantly, without losing in-progress edits. |
| + New DAG | Opens the new-DAG modal — start from a blank workflow or a starter template. Hidden for viewer accounts. |
To jump to a DAG from anywhere: focus the search box, type a fragment of the DAG id, then use Down / Up to pick from the top matches and Enter to open it. Esc closes the menu.
Shareable language deep links
Append ?lang=en or ?lang=zh to any console URL to force the language — handy when sharing a link with a teammate who reads the other language. The query param wins over the saved preference.
Signing in
Authentication is off for a plain development serve, but the default listener is loopback-only. Cronova refuses an unauthenticated non-loopback bind unless the dangerous override is explicitly enabled. Use -auth (or auth.enabled: true in cronova.yaml) for network access; cronova init creates an admin and defaults auth on for new installations.
With auth on:
- Unauthenticated visitors see a login screen (username + password) instead of the app.
- After signing in, a user chip in the sidebar footer shows your username and role — Admin (read-write) or Viewer (read-only) — with a Sign out button.
- Viewers get a read-only console: the + New DAG button and other write actions are hidden.
- If your session expires mid-use, the console bounces you back to the login screen with a "session expired" notice; sign in again and continue.
See Admin pages for managing API tokens and the audit trail that records who did what.
Edits save themselves
The console has no save button. Every change you make on a DAG or task page — flipping a schedule, editing a command, adding a dependency — is validated and written to the server automatically after a short debounce. A save-state badge on the edit pages tells you exactly where things stand:
| Badge | Meaning |
|---|---|
| Saved | Everything on screen matches the server. Safe to navigate away. |
| Saving… | An edit is in flight (saves are debounced ~400 ms and serialized). |
| Fix errors to save | The current spec is invalid — inline errors list what to fix. Nothing is written until it validates, so a half-typed edit never corrupts a working DAG. |
| Save failed | The server rejected the write (with the error message); your edit stays on screen so you can retry. |
Feedback for one-off actions — triggering a run, saving a pool, archiving a DAG — arrives as toasts in the corner. Success toasts dismiss themselves; error toasts stay until you click them.
Note
Because saves are immediate, treat edits to a live DAG as live: a schedule change takes effect on the next scheduler tick. Pause the DAG first (one click on the dashboard) if you want to stage several edits before the next run.
Common questions
Do I need to deploy the console separately from the scheduler?
No. The UI is embedded in the same Go binary and served by cronova serve alongside the REST API — one process, one port.
Can I use the console over the API instead? Yes — everything the console does goes through the same REST API, documented on the console's own API page and in the CLI reference. The console is a client, not a privileged path.
Why don't I see a save button? There isn't one. Watch the Saved / Saving… badge instead; invalid edits are held locally until the inline errors are fixed.
Is the console safe to expose on a network?
Only with auth enabled (-auth) — and ideally bound to 127.0.0.1 behind a reverse proxy with TLS. See Deploy.
What's in this guide
| Page | Covers |
|---|---|
| Dashboard | The DAG list: stat cards, filters, sparklines, pause/trigger actions |
| DAG page | One DAG's runs, structure graph, and settings tabs |
| Task editor | Editing a task: command builder, retries, template variables |
| Runs & logs | Run detail, live log streaming, retry/cancel/mark-state |
| Admin pages | Pools, variables & connections, audit log, API tokens |
New to cronova? Build your first workflow in the tutorial, then come back here to master the UI. For the full DAG spec the console edits under the hood, see the DAG reference.