Dashboard & creating DAGs
The DAGs dashboard is the home screen of the cronova web console (default http://localhost:8090) — a single page that shows every workflow definition, its recent health, and its next scheduled run. This page walks through each element of the dashboard and shows how to create a new DAG from a starter template, a cron schedule, or pasted YAML.
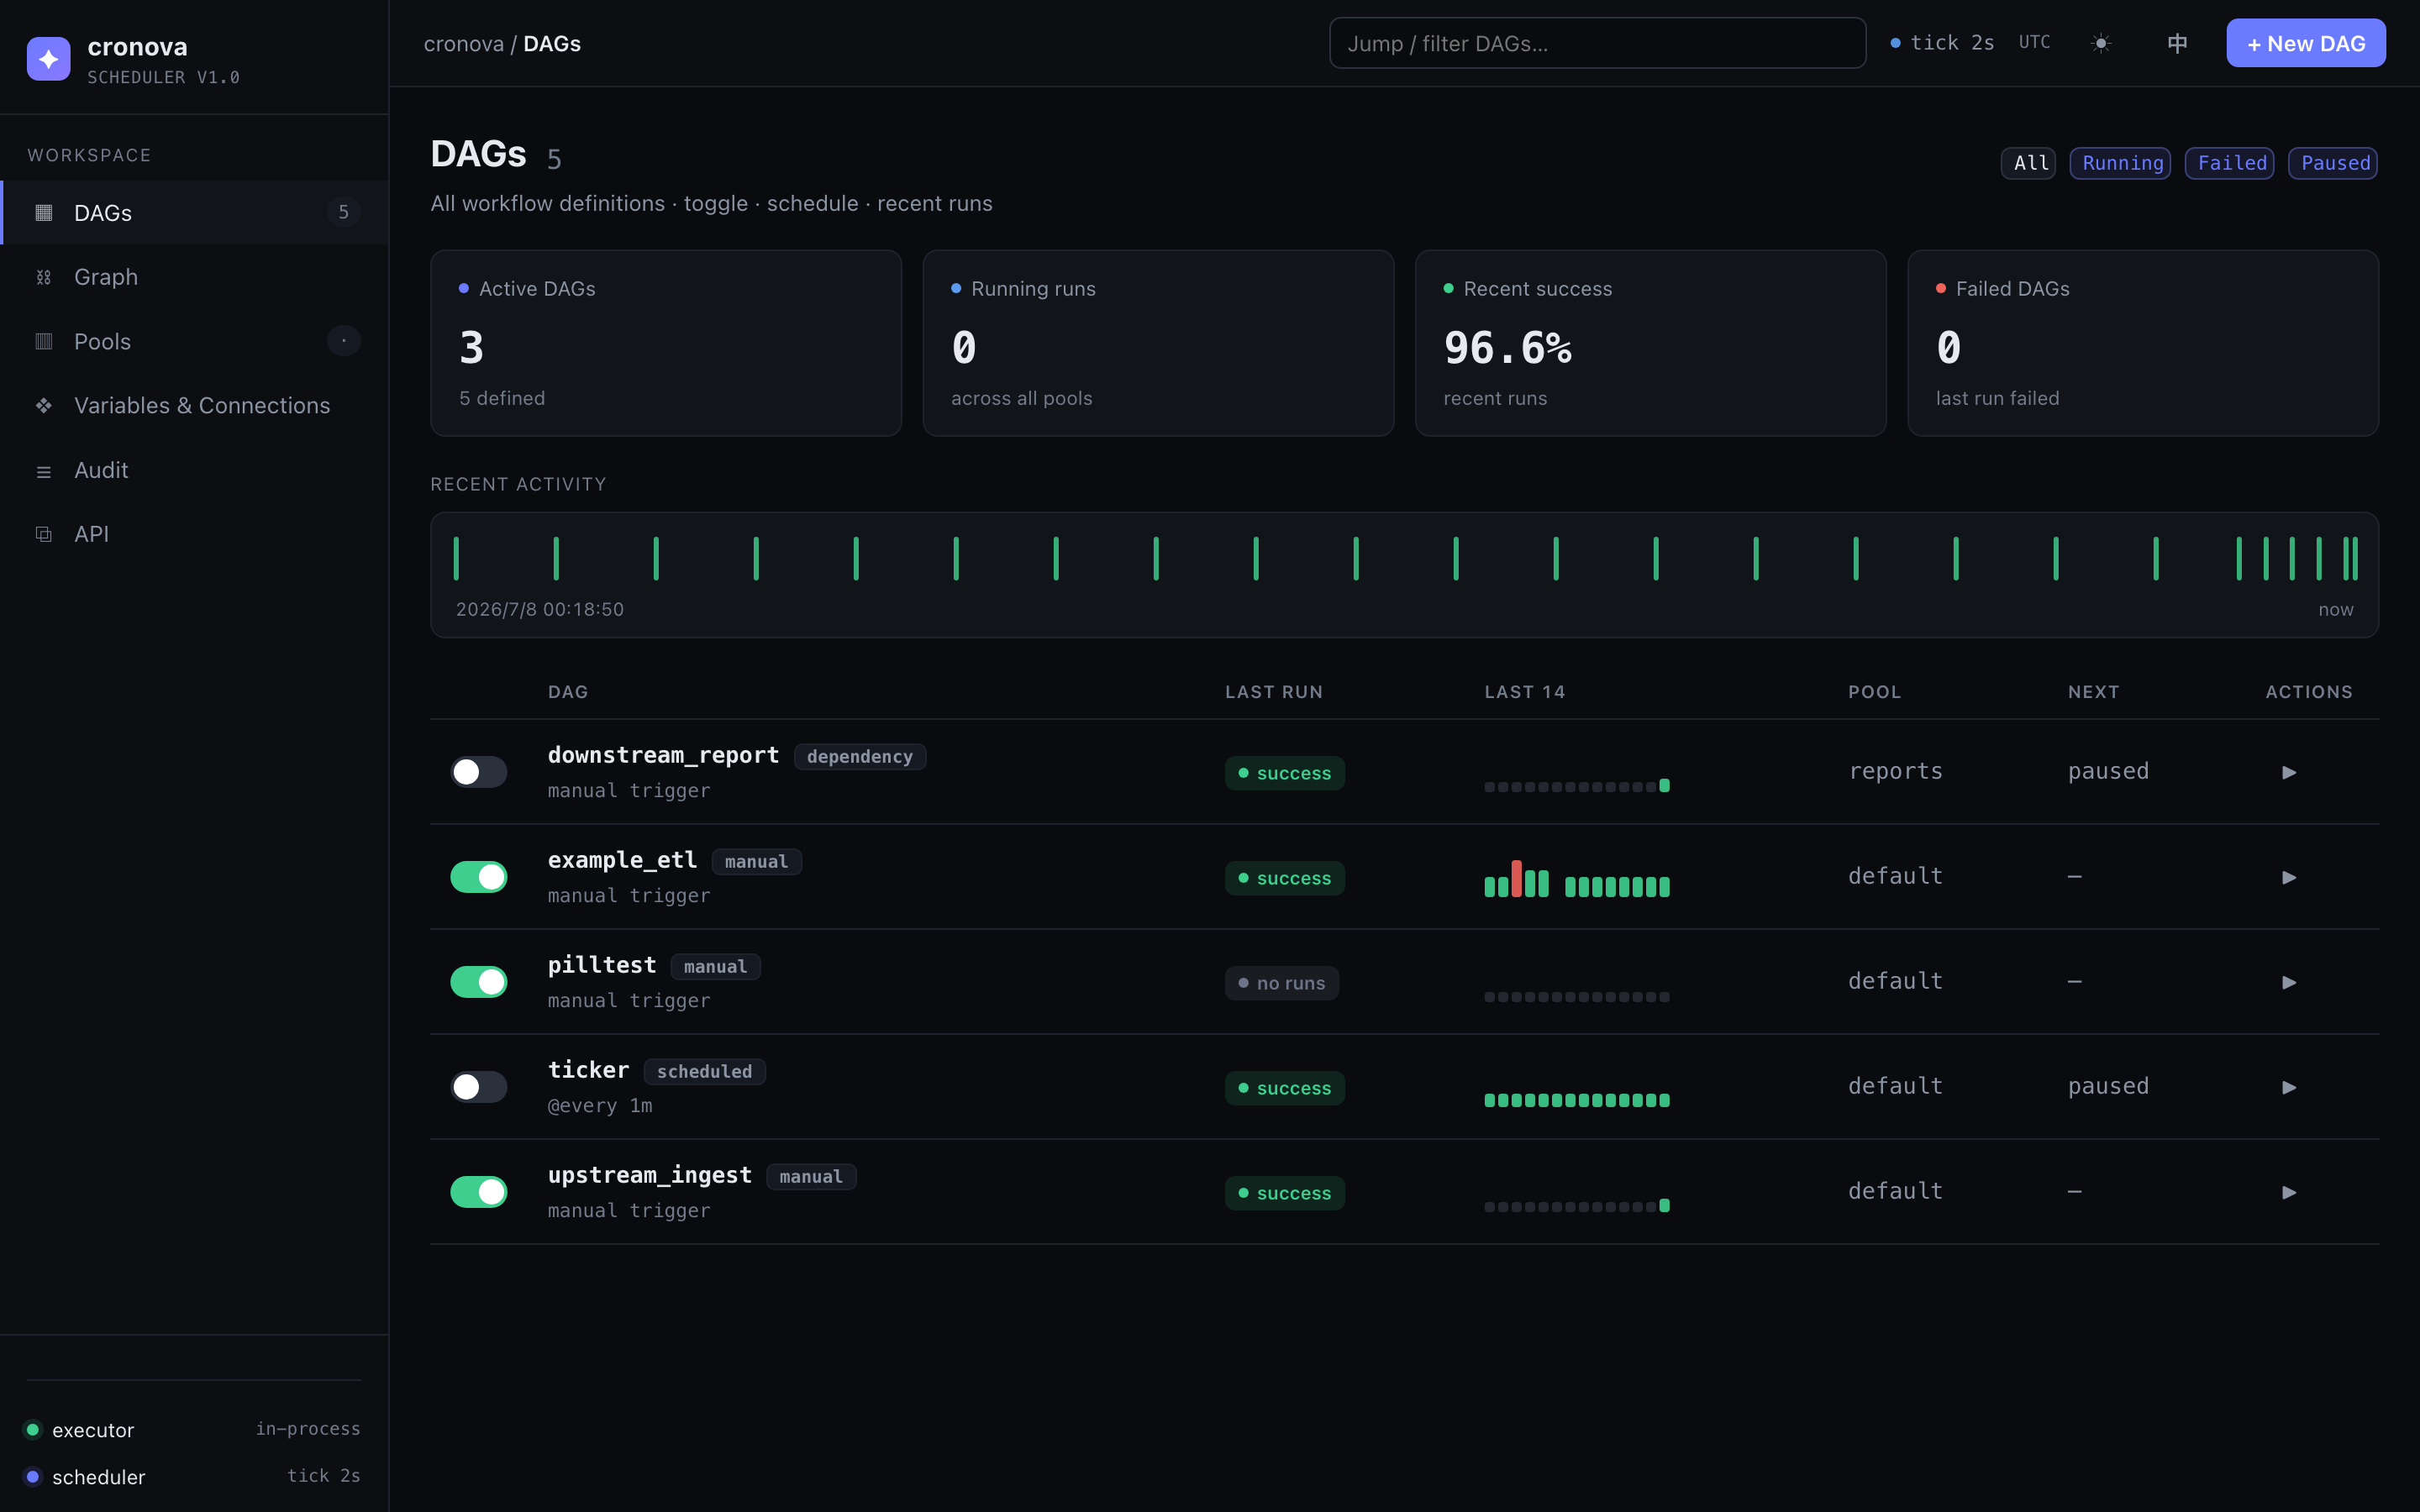
On a fresh instance the dashboard shows a "No DAGs yet" hero with a single create button. Once at least one DAG exists you get the full layout: stat cards, activity strip, and the DAG table.
Note
The + New DAG button in the topbar is only shown to admin users. Viewers get a read-only dashboard — they can browse everything but cannot create, pause, or trigger DAGs.
Stat cards
Four cards summarize the whole scheduler at a glance:
| Card | What it shows |
|---|---|
| Active DAGs | DAGs that are not paused, with the total number of definitions underneath (N defined). |
| Running runs | DAG runs currently in the running state, across all pools. |
| Recent success | Success rate (%) over the recent terminal runs — the same runs drawn in the sparklines. |
| Failed DAGs | DAGs whose most recent run ended failed or timed out. |
When Failed DAGs is non-zero the card becomes clickable — one click applies the Failed filter to the table so you can triage straight from the number.
Recent activity
The RECENT ACTIVITY strip plots the last 24 runs across all DAGs as state-colored ticks on a shared time axis, from the earliest run on the left to now on the right. Each tick sits at the run's real start time:
- Hover a tick to see the DAG id, run state, duration, and start time.
- Click a tick to jump to that run's detail page — see Runs, logs & recovery.
If nothing has run yet, the strip reads "No runs yet".
Getting-started checklist
Until you hit three milestones, a checklist bar sits above the table:
- Create your first DAG
- Trigger a run
- Get a green run (one successful run)
Each step checks off from real store data, not clicks. The bar hides permanently once all three are done; you can also dismiss it early with the ✕ button.
The DAG table
Each row is one workflow definition. Click anywhere in a row to open its operation page — see Working with a DAG.
| Column | Contents |
|---|---|
| (toggle) | Pause/resume switch. Off = paused: the scheduler stops creating runs for this DAG (manual triggers still work). |
| DAG | The DAG id, a trigger-type tag (scheduled, manual, or dependency), and a second line showing the schedule expression — or the owner, or "manual trigger" for unscheduled DAGs. |
| LAST RUN | State badge of the most recent run: success, failed, running, queued, timed out, cancelled, … or "no runs". |
| LAST 14 | Sparkline of the last 14 runs. Color encodes the run state; bar height encodes real run duration, scaled against the slowest recent run on the whole dashboard, so "taller = slower" reads consistently across DAGs. Hover a bar for state and duration. |
| POOL | The pool(s) the DAG's tasks run in (comma-separated when tasks use several). See Graph, pools, variables, audit & API. |
| NEXT | The next fire time — in Nm when under an hour away, due when under a minute away, paused for paused DAGs, — when the DAG has no schedule. |
| ACTIONS | ▶ queues a manual run immediately (you get a "Run queued" toast and the row refreshes moments later). |
Filtering
The filter chips next to the page title narrow the table:
| Chip | Shows |
|---|---|
| All | Every DAG. |
| Running | DAGs whose latest run is currently running. |
| Failed | DAGs whose latest run ended failed or timed out. |
| Paused | Paused DAGs. |
The Filter DAGs… search box in the topbar additionally narrows by DAG id substring; search and chips combine.
Create a DAG
Click + New DAG in the topbar. The modal keeps the happy path to two decisions: pick a template, name it, create.
1. Pick a starter template
| Template | What you get |
|---|---|
| Blank | An empty 0-task shell — add tasks yourself in the task editor. |
| Daily ETL | A three-step extract → transform → load shell pipeline. |
| Scheduled report | fetch → render, preset with a 0 8 * * * cron (daily at 08:00). |
| Fan-out / fan-in | start → two parallel branches → join. |
Templates create real, editable shell tasks — the ETL and report templates use {{ logical_date }} and {{ run_id }} so you can see template variables in action. Picking Scheduled report auto-expands the schedule section so its preset cron stays visible and correctable.
2. Name it
Enter a DAG ID — letters, digits, _, -, ., starting with a letter or digit. The modal validates as you type and flags a duplicate id immediately; Create stays disabled until the id is valid. Press Enter to submit.
3. Set a schedule (optional)
Click Schedule & more options to expand the schedule editor. Three modes:
| Mode | Behavior |
|---|---|
| Manual | No schedule — the DAG runs only when triggered by hand, by the API, or by an upstream DAG. |
| Interval | @every N seconds/minutes/hours — a fixed-interval schedule. |
| Cron expression | A standard 5-field cron expression. |
In cron mode, preset chips fill the field with one click — every minute, hourly, daily 0:00, daily 2:00, Mon 0:00 — and the ? button opens a cron cheat sheet with the field layout, operators, and clickable examples and shortcuts (@hourly, @daily, @every 30s, …).
As you type, a live preview asks the server to compute the next 3 fire times and shows them under the editor, with a plain-language gloss for interval and preset schedules ("daily 2:00 — Next: …"). An invalid expression shows an error instead — the console never guesses fire times client-side.
Scheduled modes also expose a Start date field. A Catchup checkbox is visible but not yet editable from the console — see Scheduling & catchup for how catchup works.
Tip
Nothing here is final. The schedule, start date, and everything else are editable any time later from the DAG's Settings tab, and every edit auto-saves — see Working with a DAG.
Or import YAML
Click or paste YAML to import… to switch the modal to a YAML textarea. Paste a full DAG spec:
Import sends it through the exact same parser and validation the REST API uses — the console never re-implements the format. On success you land directly on the new DAG's page. The spec format is documented in the DAG & Task Reference.
After creation
You land on the DAG's operation page with the template tasks (or a 0-task shell) ready to edit. There is no Save button anywhere — the console persists each edit automatically and shows a Saved / Saving badge in the header. Continue with Working with a DAG and The task editor, or follow the first-DAG tutorial end to end.
Common questions
Where is the Save button? There isn't one. The console auto-saves every DAG edit with a short debounce and shows a Saved / Saving status badge; a Fix errors badge appears instead if the current state can't be persisted.
What makes a DAG count as "failed" on the dashboard?
Its most recent run ended failed or timed out. Both the Failed DAGs card and the Failed filter chip use this rule.
Can I create a DAG without a schedule? Yes — leave the schedule mode on Manual (the default). Run it with the ▶ button, the REST API or CLI, or from an upstream DAG via cross-DAG triggers.
What does "due" in the NEXT column mean? The next fire time is less than a minute away — the scheduler will pick it up on its next tick.