Runs, logs & recovery
The run page (#/run/<run_id>) is where you watch a single DAG run execute live and recover it when something breaks — dependency graph, per-task instances, streaming logs, and the cancel / retry / mark operator actions, all in one screen of the cronova web console.
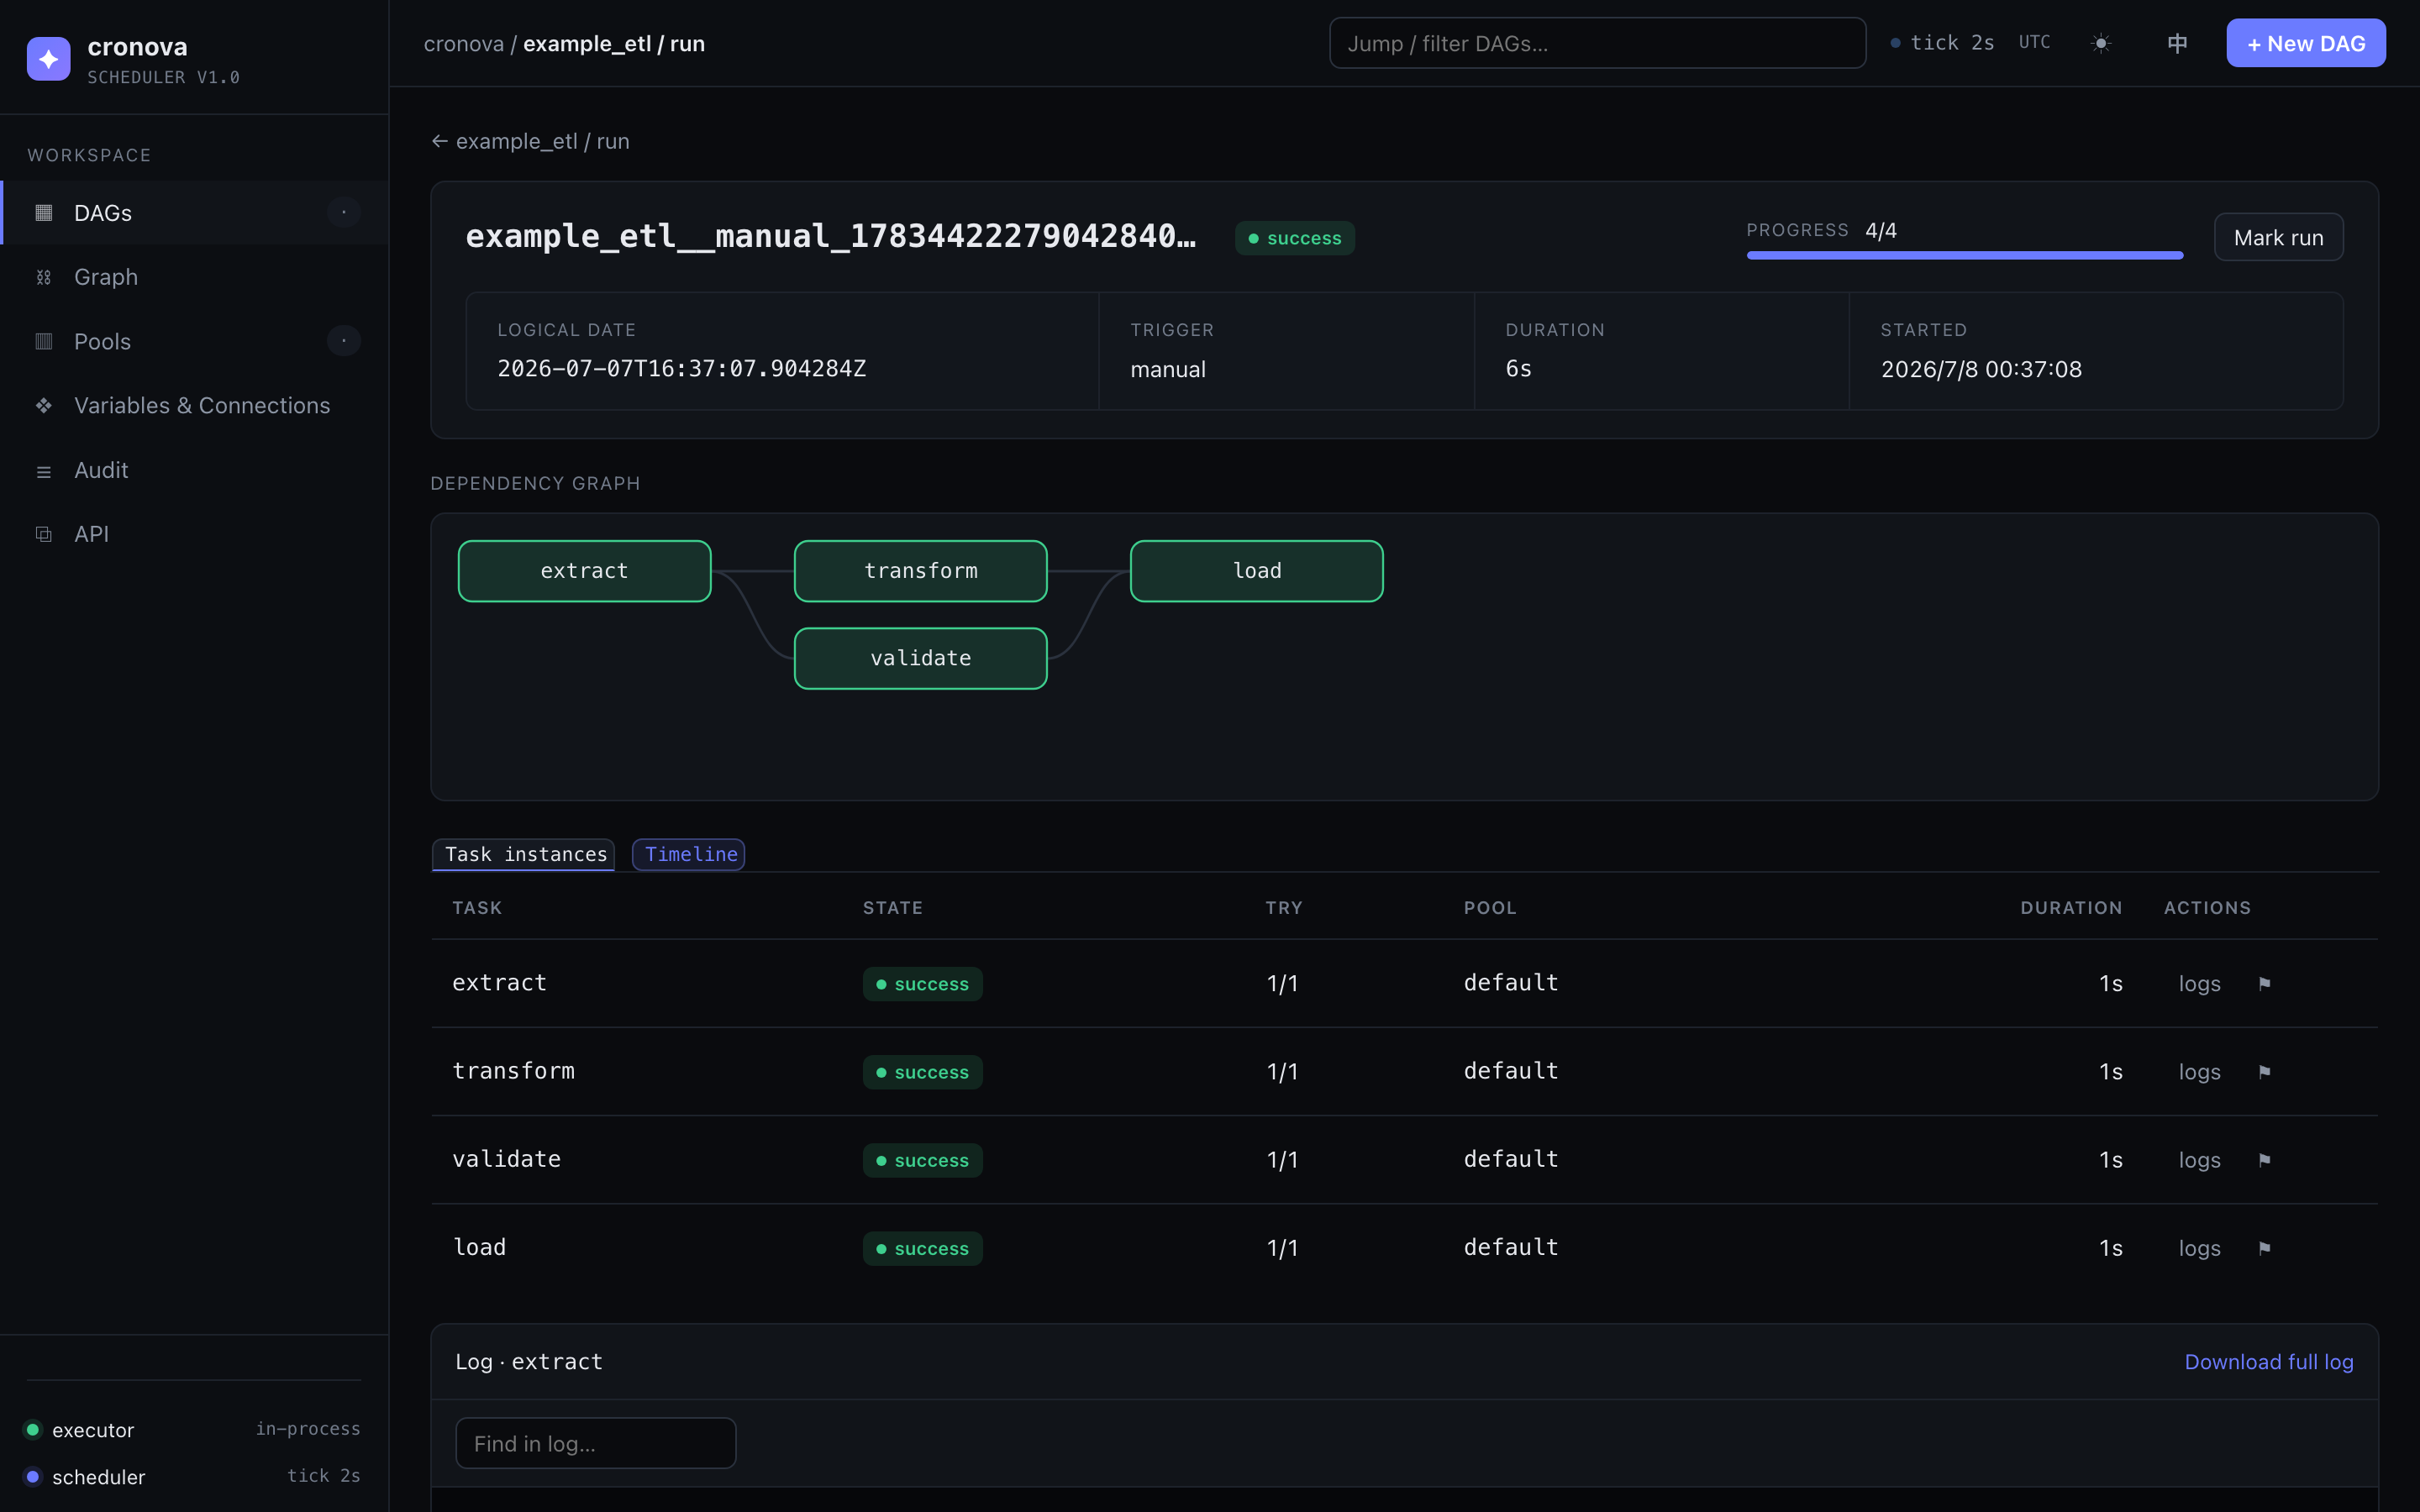
You get here by clicking any run row in a DAG's run history (see Working with a DAG), or by opening a #/run/<run_id> URL directly — run URLs are stable deep links you can paste into an alert or a chat thread.
The run header
The top of the page summarizes the whole run and updates in place while it executes:
| Element | What it shows |
|---|---|
| Run id | Monospace id — click it to copy. |
| State badge | The run's current state (queued, running, success, failed, cancelled, timed out), recolored live. |
| Progress | A done/total counter with a meter bar — how many task instances have reached a terminal state, plus · N running while tasks are executing. |
| Logical date | The data interval this run represents (click to copy) — see Scheduling & catchup. |
| Trigger | How the run started: scheduled, manual, dependency, or event. |
| Duration | Wall-clock time from start to finish; ticks up while the run is active. |
| Started | When the first task was dispatched. |
If the run was triggered with parameters, a chip bar below the header lists each key=value pair (see Variables, connections & params).
On the right of the header sits the run-level action — Cancel run while the run is active, or Retry failed and Mark run once it has finished. Which buttons appear depends on the run state and your role; details in Recovering a run below.
Dependency graph
The same DAG graph you know from the DAG page, but colored live by task state: each node's fill tracks its task instance, and running tasks pulse. As the scheduler works through the workflow you can literally watch the wave of green move across the graph — and a red node with grey upstream failed nodes behind it points you straight at the root cause. The graph pans and zooms with the mouse.
Task instances
Below the graph, two tabs switch between the instances table and the timeline.
The Task instances tab lists one row per task in the run:
| Column | Meaning |
|---|---|
| task | The task id, as defined in the DAG YAML. |
| state | State badge: scheduled, queued, running, retrying, success, failed, upstream failed, skipped, cancelled, timed out. |
| try | n/m — attempt number out of the maximum (max_retries + 1). Automatic retries increment n; see Retries, timeouts & pools. |
| pool | The concurrency pool the task runs in (managed on the admin pages). |
| duration | Wall-clock time for the task's latest attempt window. |
| actions | logs opens the log panel. On a finished run, ↻ retries a failed/cancelled/timed-out task. ⚑ marks the task's state (operator override). |
The Timeline tab renders the same instances as a Gantt chart: one bar per task, positioned and sized by its real start and finish times, colored by state. Hovering a bar shows task, state, duration, and start → finish; a ×n badge next to the task name flags tasks that took more than one attempt. Tasks that never ran (e.g. skipped or upstream failed) show a muted label instead of a fabricated bar. Clicking a row opens that task's log.
The log panel
When you open a run, the log panel at the bottom opens automatically for the most useful task: the currently running one if there is one, otherwise the first task that hasn't finished, otherwise the first task. Click logs on any row (or a timeline row) to switch tasks.
The panel gives you:
- Live tailing — while the task runs, its stdout/stderr streams into the panel over SSE and the view auto-follows to the newest line. Opening a large existing log starts from its latest 1 MiB rather than replaying the entire file. A pulsing live indicator shows the stream is open; it disappears when the task finishes.
- Find in log — type in the filter box to show only matching lines (case-insensitive), with a running match count.
- Download full log — a link in the panel header downloads the complete captured log file as
<task>.log.
Note
The live view buffers the last 5,000 lines (a showing last 5000 lines hint appears when trimmed). Download full log streams the entire captured file. Each task attempt is capped at 64 MiB on disk; excess output is discarded after a visible truncation marker. Each retry writes a fresh file, so the panel shows the current attempt, not a concatenation of every try.
Recovering a run
cronova's recovery actions live right on the run page, and every one of them is recorded in the audit trail. What you see depends on the run's state — and viewers (read-only role) see no operator actions at all:
| Action | Where | Appears when | What it does |
|---|---|---|---|
| Cancel run | Header | Run is queued or running |
After a confirmation ("Running tasks will be killed."), kills every running task process, marks unfinished tasks cancelled, and finalizes the run as cancelled. |
| Retry failed | Header | Run finished with at least one failed, upstream failed, cancelled, or timed out task |
Resets those tasks and their downstream back to scheduled and reactivates the run. Tasks that already succeeded are not re-run. |
| ↻ Retry (per task) | Instances row | Run finished; task is retryable | After a confirmation, resets this task and all of its downstream tasks and re-runs that subtree. |
| ⚑ Mark state (per task) | Instances row | Any time (admins) — works on active runs too | Pick success, skip, or failed. A still-running task is killed first. Marking success/skip releases downstream tasks that were blocked as upstream failed; a finished run is reactivated so the scheduler re-drives it. |
| Mark run | Header | Run finished | Pick success or failed. Overrides the run's recorded outcome without touching task states. Marking success fires any downstream-DAG triggers, exactly as a natural success would — see Cross-DAG triggers. |
Tip
Rule of thumb: Retry when you want the work re-executed; Mark when the outcome is already handled (you fixed it by hand, or the failure doesn't matter) and you just need the scheduler's bookkeeping — and downstream — to move on.
Warning
A per-task ↻ retry resets the task's entire downstream subtree, not just the one task — the confirmation dialog spells this out. Check the dependency graph first if downstream tasks have side effects you don't want repeated.
Every action here is also available from the REST API and the CLI (cronova cancel, cronova retry, cronova mark, cronova logs) — see the CLI reference.
Live refresh & how retries look
While the run is active the page polls every 2 seconds and patches everything in place — state badges, the progress meter, graph node colors, the instances table — without tearing down an open log stream or stealing keyboard focus. When the run reaches a terminal state, polling stops and a toast reports the outcome.
Retries are visible in three places: the state badge flips to retrying between attempts, the try column increments (2/3, 3/3, …), and the log panel starts a fresh attempt log. Operator-initiated retries keep the counter accumulating rather than resetting it, so the try count remains an honest history of how many times the task actually executed.
Common questions
Why is there no Retry button on my failed run?
Retry appears only on a finished run that still has retryable tasks. If the run shows running or queued, cancel it first. If every task succeeded or was skipped, there's nothing to retry — use Mark run if you need to override the recorded outcome.
Can I retry just one task without re-running the whole DAG? Yes — ↻ on the task row. It re-runs that task plus its downstream subtree; upstream tasks that already succeeded stay untouched.
Why can't I mark a run that's still running? An active run's state is derived from its task states, so a direct override would be immediately overwritten. Cancel the run, or mark the individual tasks instead — task-level marks work on active runs.
Where did my log go after a retry? Each attempt starts a fresh log file. The panel (and the download link) shows the latest attempt.
Who can use these actions? Writes are admin-only. Viewer tokens and viewer sessions get a read-only run page — no cancel, retry, or mark buttons. See API tokens & roles.